Over the past half-century, gentrification has quietly transformed the face of American cities. While bringing investment and revitalization, it has also driven out longtime Black residents and eroded historic communities. A new analysis reveals the scale—and the stakes—of this national shift.
The slow surge of gentrification
Over the past fifty years, gentrification has steadily crept through the streets of American cities, subtly altering their landscapes. What began as isolated pockets of change in the 1970s has become a nationwide trend, with entire neighborhoods shifting in demographic and economic character. According to new data, only 15% of urban neighborhoods show signs of gentrification—but that fraction conceals a dramatic acceleration in recent decades.
In the 1970s, only 246 neighborhoods across the U.S. experienced signs of gentrification. By the 2010s, that number had ballooned to over 1,800. The rise in such neighborhoods points not only to increased development and investment but also to the intensifying pace at which historically marginalized communities are being reshaped—and, often, displaced.
Cities like Nashville, Tennessee; Washington, DC; the San Francisco Bay Area; Denver; and Austin, Texas emerged in the 2010s as hotspots of gentrification, leading the trend in both scale and intensity. In these cities, cultural and economic change has marched hand in hand, reshaping neighborhoods that were once hubs of Black life.

Displacement in numbers
Gentrification isn’t just a story about renovated row houses or craft coffee shops—it’s a story about who gets to live in a neighborhood, and who doesn’t. From 1980 to 2020, 523 majority-Black neighborhoods experienced gentrification. In about a third of these communities—155 in total—Black residents became a minority, the neighborhood undergoing full racial turnover.
Another quarter of these neighborhoods transitioned into racially mixed communities. While diversity can be a positive development, in the context of gentrification, it often reflects a one-way street: Black residents moving out, wealthier (often white) newcomers moving in. In many cases, the cultural and social fabric of the community is altered beyond recognition.
The numbers are stark. Across all gentrifying neighborhoods that were once majority-Black, there are now 261,000 fewer Black residents. Some estimates suggest that displacement could be even higher, with as many as half a million Black people pushed out over the past four decades. These shifts are not merely demographic—they are deeply personal, affecting homes, schools, networks, and legacies.

Cities most affected
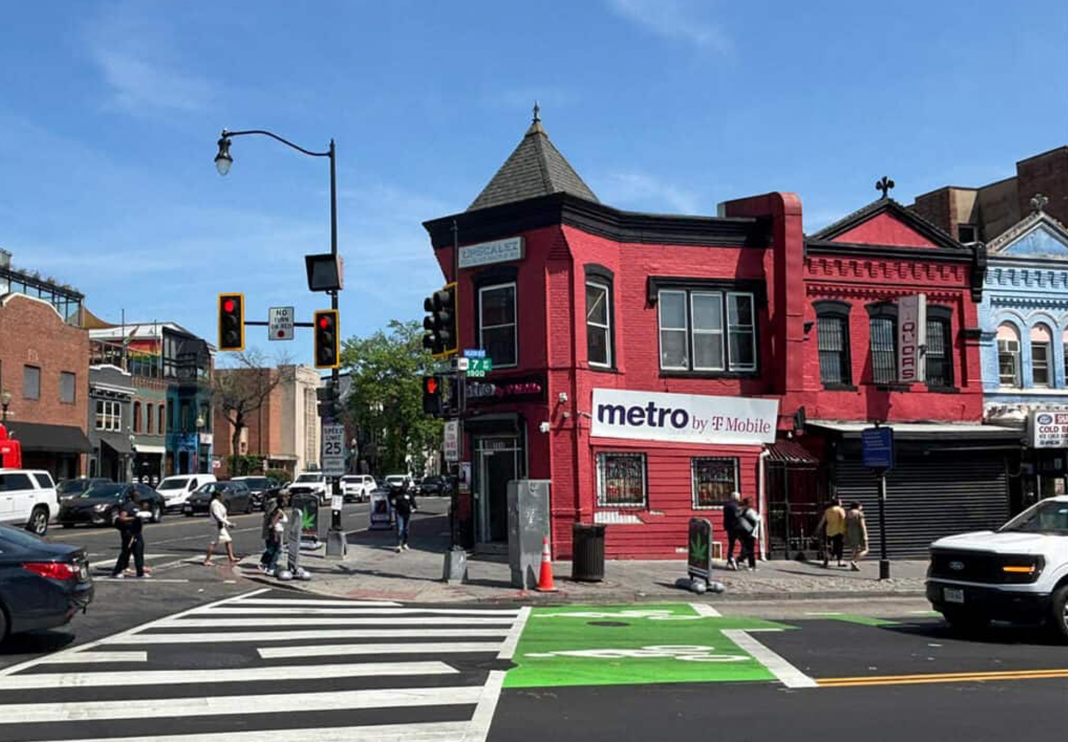
Not all cities have been impacted equally. Some have emerged as flashpoints of racial turnover and displacement. Washington, DC, for instance, has long been known for its vibrant Black cultural life—once affectionately dubbed “Chocolate City.” But in recent decades, it has seen significant demographic change, with longtime Black residents leaving in large numbers as rents and home prices soared.
Other cities, such as New York, Philadelphia, New Orleans, Atlanta, and the San Francisco Bay Area, have followed a similar trajectory. Each of these urban centers has grappled with rising housing costs, public and private investment, and the ripple effects of redevelopment. In many cases, the very policies designed to spur economic growth have unintentionally—or, some argue, intentionally—accelerated the displacement of Black communities. Neighborhoods that once stood as symbols of Black resilience, innovation, and culture are now unrecognizable. What’s left behind is a troubling paradox: prosperity for some, loss for others.

Mapping the impact
A powerful new tool is helping make sense of these complex transformations. The Displaced by Design interactive map offers a detailed, visual representation of fifty years of gentrification across U.S. cities. Covering the years 1970 to 2020, the application allows users to explore changes at the neighborhood level—from shifts in racial and ethnic composition to changes in median income, education levels, and housing values.
What sets this tool apart is its ability to tell both a macro and micro story. At a glance, it highlights broad patterns of urban change; zoom in, and you see the granular impacts on specific neighborhoods. By visualizing the cumulative effects of urban policy, private investment, and market dynamics, the map underscores a crucial truth: gentrification doesn’t happen by accident—it happens by design.
The map serves as both a data-rich resource and a call to action. For urban planners, policymakers, and community advocates, it offers insights that can shape more equitable development strategies. For residents, it provides a way to understand—and perhaps reclaim—the story of their neighborhoods.

Toward more just cities
The story of gentrification in America is not yet finished. As cities continue to grow and change, the challenge is not merely to track development but to manage it ethically. Can revitalization happen without erasure? Can investment uplift without displacing?
Recognizing the patterns of the past is the first step toward a more inclusive future. By acknowledging how policies and market forces have displaced Black communities, we open the door to solutions—affordable housing, community land trusts, tenant protections—that prioritize people over profit. Displacement by design may have defined the past fifty years. But with intention, transparency, and courage, more just cities can define the next fifty.


